You did great work
this month.
Can you prove it?
METRICS THAT CLICK · FOR SOCIAL MEDIA MANAGERS
Learn what your metrics mean and how to explain them, so clients and bosses stop second-guessing you and start trusting your calls.
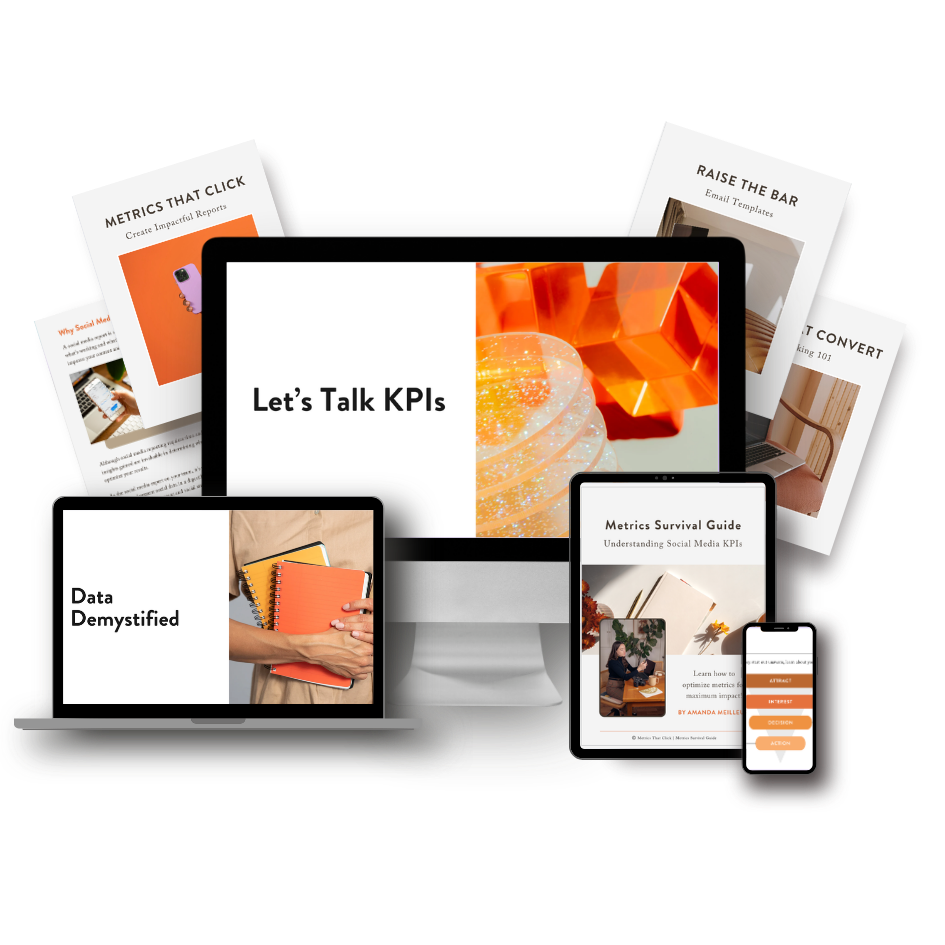
One-time payment · Instant access · Videos + templates
From a decade working in social at brands like Starbucks and running an agency.
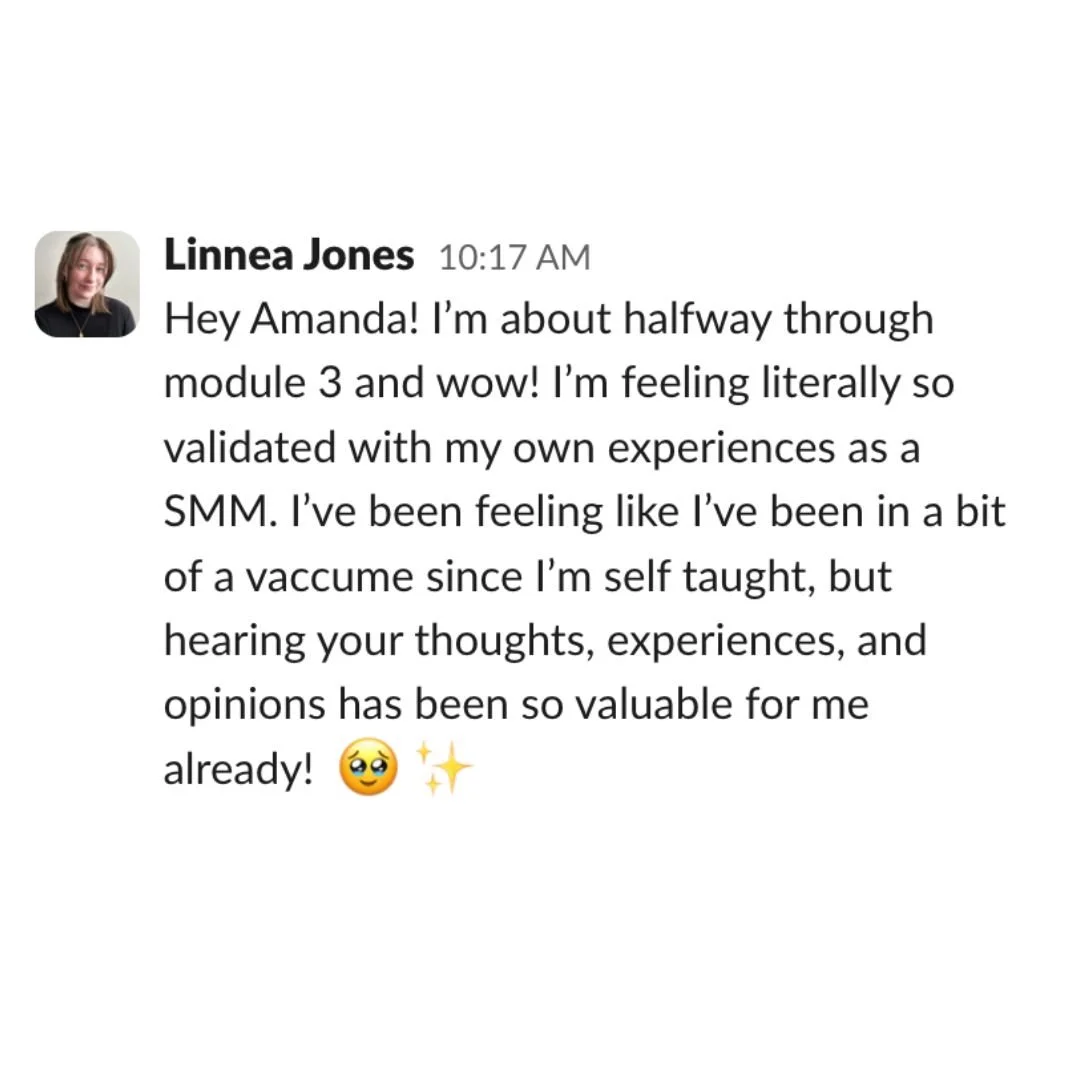
“Metrics That Click truly changed my business for the better!”
—Linnea Jones, Social Media Manager
You're not bad at this. Nobody taught you.
"Oh, you just play on social media all day?"
"Can't we just get an intern to do that?"
"My nephew's great at Instagram. He could do your job."
People don’t see the work. Your numbers should prove it, but nobody showed you how to explain them.
Then someone asks:
“Okay, but how many sales came from this?”
And if you can’t answer, the nephew starts sounding like a pretty good deal.
I’ve been there. In 2016 I got handed my first client reports. Clients were happy, but when they asked why? Deer in headlights.
I once even called Gen X “old” when reviewing demographics. The client was Gen X. 😬
So I nerded out. I learned every metric and figured out how to explain what’s working, why, and what’s next.
My reports kept clients around for years, even after I raised my rates.
This course teaches you how to do the same.
CAN AI DO IT FOR ME?
Kind of. I use AI too. But I’ve seen AI dashboards pull the wrong numbers more times than I can count, and the summaries rarely explain why, or what to do next month.
I’ve even seen AI call engagement “down” when it was actually up. Then it made up a reason.
If you don’t know your data, you won’t catch that. Your client or boss might.
When everyone has an AI report, the people who get trusted, hired and paid more are the ones who can explain it and say what to do next.
You don’t need to be good at math. You just need to know the story behind the numbers.
What’s Inside?
BY THE END, YOU’LL HAVE:
A monthly report you can send to your client or boss, built from my template
KPIs tied to what businesses and leadership care about
A case study of your best work, ready for your portfolio or next interview
Scripts and processes for raising your rates or asking for a raise
Start with the templates on day one. Watch the videos at your own pace.
⬆️ Take a look inside (3 min) ⬆️

Five Modules. Go at your own pace.
Module 1: Making sense of Metrics - (45 Min)
How to track metrics without overwhelm, analyze performance, make better decisions, and communicate an ROI.
Module 2: Tying metrics to real goals - (21 Min)
How to choose KPIs that match what your client or company actually cares about, so your report answers "what did this do for the business?" before anyone asks.

Module 3: BUILDING THE REPORT - (70 min)
How to put together a monthly or quarterly report that's short, clear and actually gets read.


Module 4: Wins into Case Studies - (25 Min)
How to use your best results to create a case study that helps you land the next client or job.
Module 5: Presenting and getting paid - (40 Min)
How to walk someone through your report with confidence, what to charge for reporting, how to raise your rates, and how to ask for a raise if you're in-house.
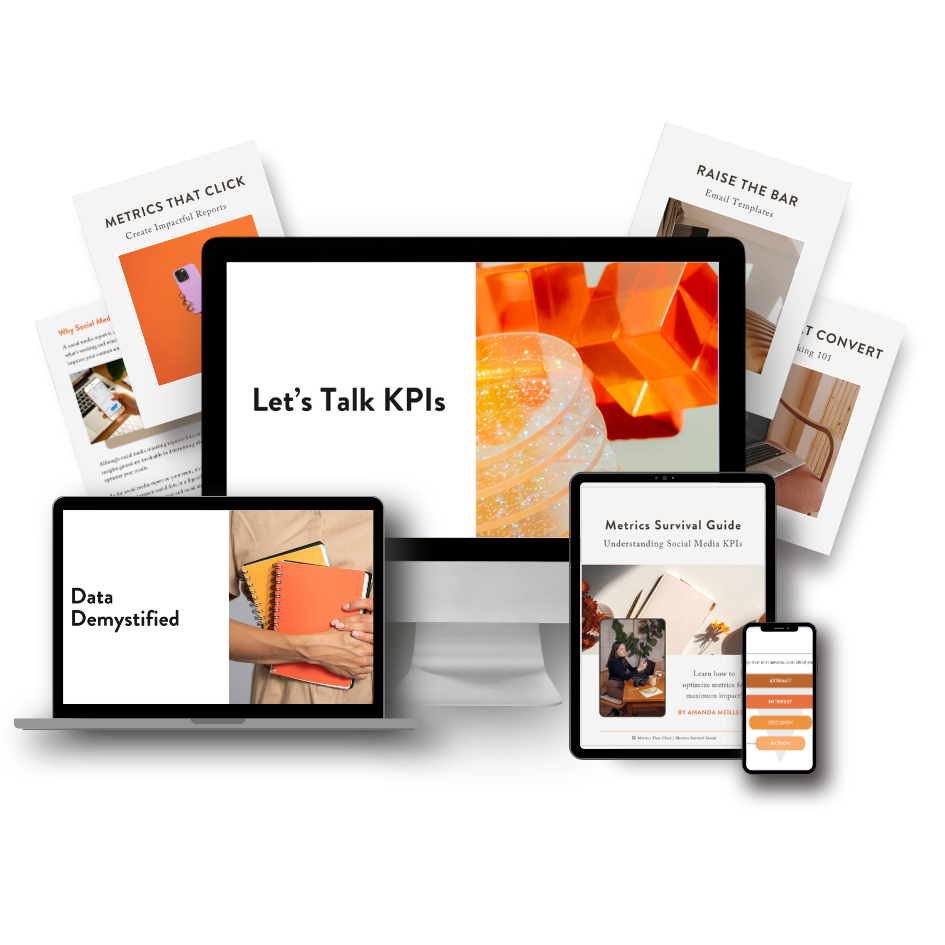
Also in the folder:
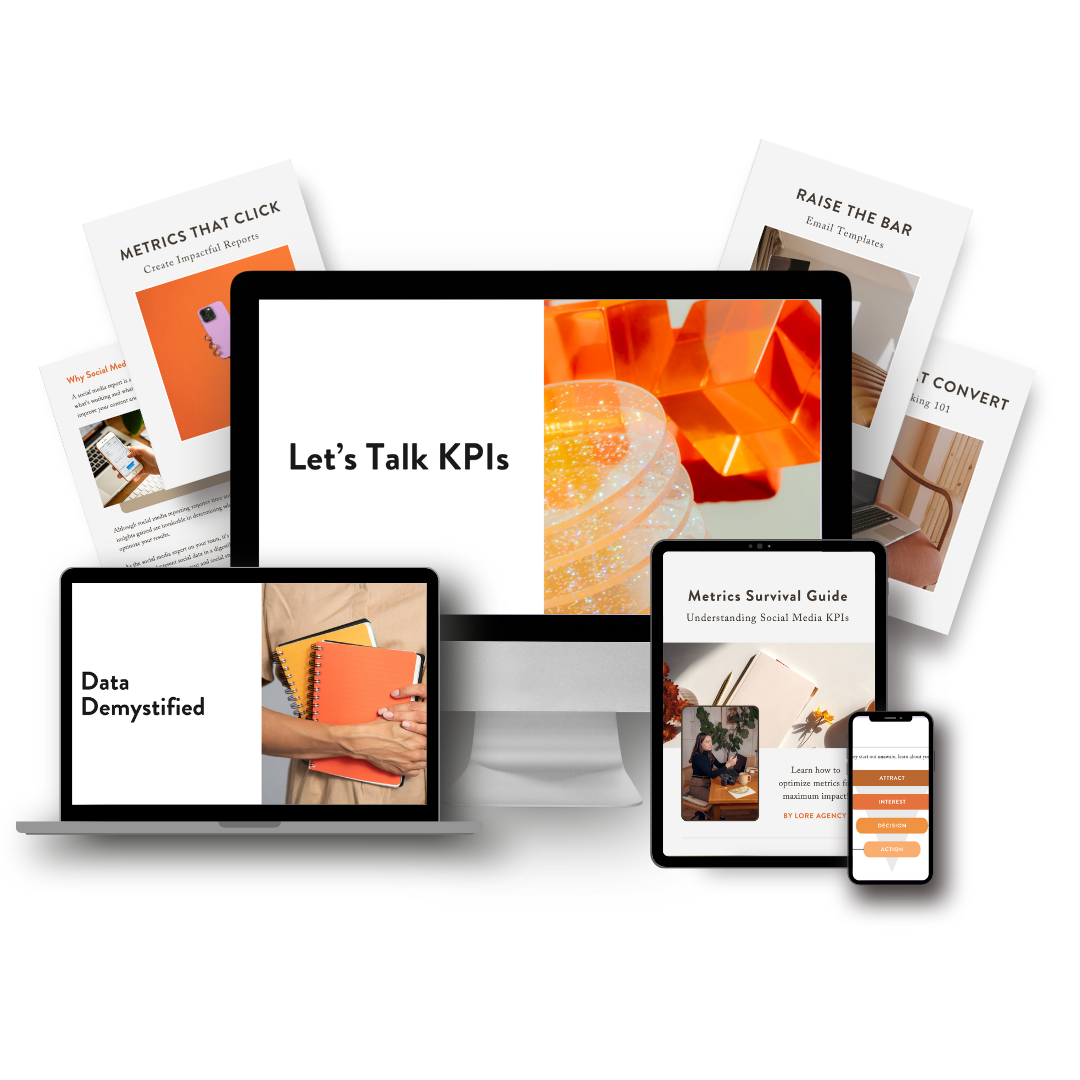
Monthly and quarterly report templates
KPI tracker spreadsheet
Case study template
Data strategy workshop
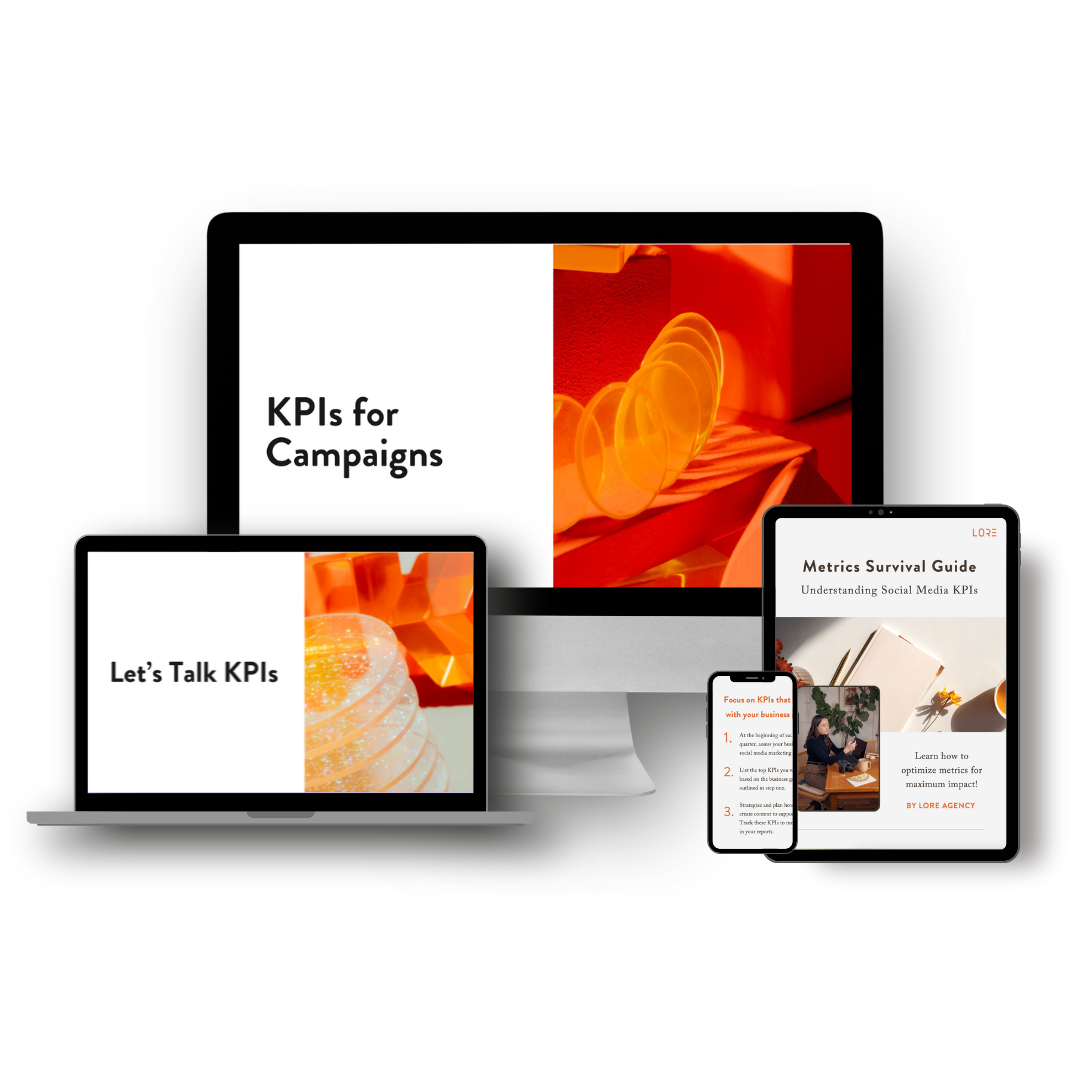
Metrics Survival Guide (the cheat sheet you'll keep open)
Guides for raising your rates and negotiating a raise
Email templates for asking for more money
Covers Instagram, Facebook, TikTok, LinkedIn, Pinterest, YouTube, X and Threads. Videos, worksheets and templates, all in one Google Drive folder. Most people work through it in about four weeks.
What a student said
"Metrics That Click truly changed my business for the better!
Not only did I learn invaluable information about social media analytics, I built my confidence in displaying and presenting that information to my clients in a way that works for them!
This has allowed me to change my business model and analyze incoming data with confidence. My clients have benefited tenfold and so have I.
Seriously, this course is packed with the best info, I can’t recommend it enough!"
—Linnea Jones, social media manager

Hey there, I'm Amanda! 👋
I've spent over a decade in social media, working on brands like Starbucks, and running my own agency, Saveur Studio. I went from fumbling through client reports to being the person executive leadership and clients count on to explain the numbers and share strategic recommendations.
Fun fact: I rescued three cats, one of which was pregnant when she showed up at my house. 😻
My husband and I raised six kittens and found them loving homes, keeping one kitten for ourselves.
what people i’ve worked with say
"One of the best hires of my career!”
— Sade, Marketing SVP


"Amanda led the Starbucks Reserve social marketing strategy, including reporting."
— Natalie, Director, Brand & Product Marketing
"Amanda is a confident public speaker and performed several presentations in front of our team."
— Jessica, Marketing Manager

THIS IS FOR YOU IF…
You've looked at your insights and thought, "Okay… but what does this actually mean?"
You check in with your clients or boss about how things are going, and you wish you had something more solid to show them.
You're creative first, and the numbers side has always felt like someone else's job.

Social Media Freelancer
When a client can't see what your work is doing for them, the cheaper option starts to look good.
A clear report shows them, and gives you a reason to charge more instead of less.

IN-HOUSE Social Media Manager
Your boss has to justify your role to leadership. Your report is evidence of your impact on the business.
This also gives you data to use for your next review so you can justify a raise.
It's probably not for you if…
You're looking for a tool that automates your reports. This teaches you to understand and explain them.
You want Google Analytics or paid ads metrics. This course is all organic social.
You're looking for live coaching or a community. This one's self-paced, just you and the material.
metrics that click: $79
One-time payment · Instant access
Five modules, monthly and quarterly report templates, a KPI tracker, the Metrics Survival Guide, and guides for raising your rates or asking for a raise.
One raise or one client who sticks around is worth way more than $79.
No webinar. No email sequence. Just the course I wish someone had handed me early in my career.
Since it’s a digital download, all sales are final.
Questions?
-
About 3 and a half hours of video in total, split into short lessons. Most people take it a module a week. You can use the templates right away and watch the videos whenever.
-
Yes. I explain metrics in plain language. No complicated math, I promise.
-
Most of us are. This course fills in the gaps so you don’t have to struggle with uncertainty.
-
No. It teaches you to understand and explain your data, which keeps you from passing along its mistakes. The goal is for you to be the source of truth, not AI. So when someone asks why engagement is down, you can explain it confidently.
-
Right after checkout you'll land on a page with your Google Drive link. Bookmark it.
-
You’ll have ongoing access to the course folder, and you can save your own copies of templates and guides, so those are yours to keep.
-
Since it's a digital download, all sales are final.
-
It covers the most popular ones: Facebook, Instagram, TikTok, LinkedIn, Pinterest, YouTube, X, and Threads.
METRICS THAT CLICK
The next time someone asks,
“So how many sales came from this?”
you’ll have the answer.
One-time payment · Instant access
© Saveur Studio 2019-2026 all rights reserved. Privacy Policy